Kubernetes Observability: Prometheus + Grafana in Action
After deploying an application to Kubernetes, maintenance is the next crucial step. As you know, maintenance include many things and one of them is Monitoring, this is the backbone of it all. And when talk about monitoring in Kubernetes, we usually remember to Prometheus & Grafana
What are they?
Prometheus and Grafana provide real-time Kubernetes cluster visibility, enabling early issue detection and performance optimization for resilient and reliable applications. For a simple term, Prometheus collects data, Grafana displays it and both them are open-source.
How they work?
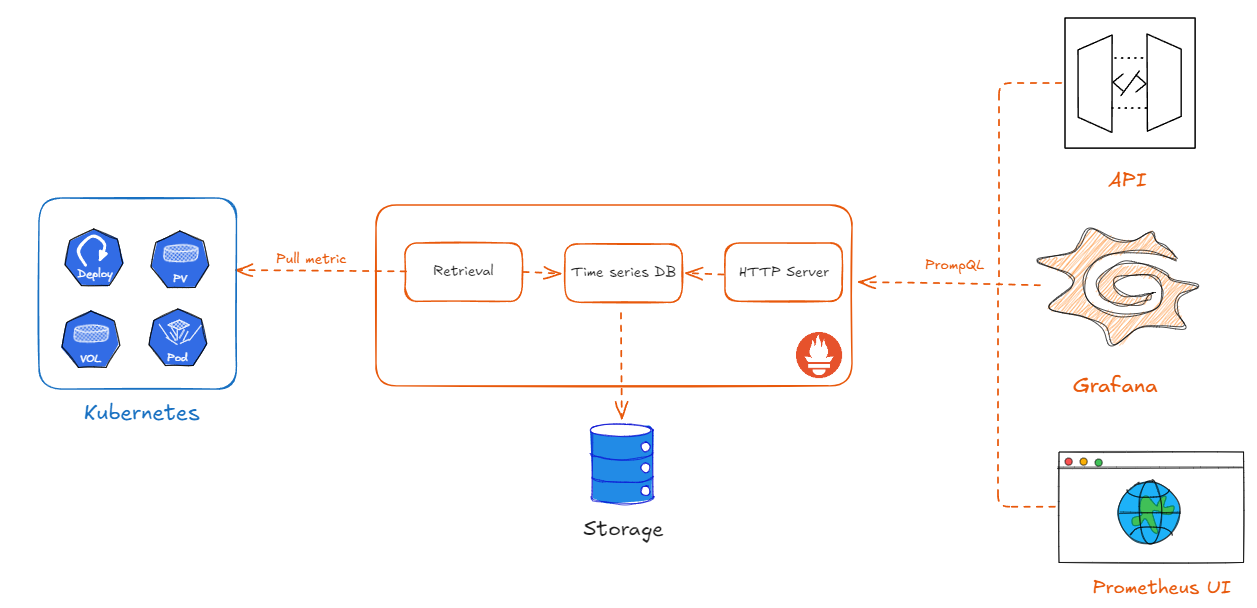
Prometheus periodically collects metrics from targets, such as Kubernetes systems, and stores them in a database. An HTTP API server listens for requests from clients (Grafana, Prometheus UI, API) and responds with data for display.
Installation
1) Config database to store Prometheus data
Run it on nfs-server
sudo mkdir -p /export/k8s
sudo chown -R nobody:nogroup /export/k8s
sudo chmod 0777 /export/k8s
echo '/export/k8s  *(rw,sync,no_subtree_check,no_root_squash)' | sudo tee -a /etc/exports
sudo exportfs -ra
sudo systemctl restart nfs-server
2)Install NFS utilities
Run it on worker node
sudo apt-get update && sudo apt-get install -y nfs-common
Mount the NFS share temporarily (remember replace your ip nfs-server) - this is for test purposes, you can ignore this step
sudo mount -t nfs4 <IP_NFS_Server>:/export/k8s /mnt && ls /mnt && sudo umount /mnt
Those commands are used during the setup of dynamic storage provisioning in Kubernetes. It 's ensured:
- All nodes can access NFS server
- The exported path in NFS is readable and writable
3) Install Dynamic Provisioner
Run it on master node (remember replace your setting)
# Add repo + update
helm repo add nfs-subdir-external-provisioner https://kubernetes-sigs.github.io/nfs-subdir-external-provisioner/
helm repo update

# install to kube-system
helm upgrade --install nfs-provisioner \
  nfs-subdir-external-provisioner/nfs-subdir-external-provisioner \
  -n <YOUR_NAMESPACE> \
  --create-namespace \
  --set nfs.server=<IP_NFS_Server> \
  --set nfs.path=/export/k8s \
  --set storageClass.name=<STORAGE_CLASS_NAME> \
  --set storageClass.defaultClass=false
You can get an error about namespace validation, you can follow this link to fix.
After successful installation, an image like the one below will be displayed.
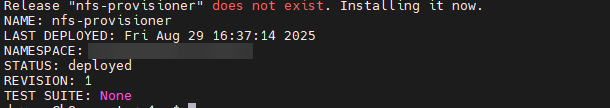
To make sure everything is work, run following command
kubectl -n <YOUR_NAMESPACE> get pods -l app=nfs-subdir-external-provisioner
kubectl get sc
You must see nfs storage have dynamic provisioner

4) Install kube-prometheus-stack
Run it on master node
# Create a namespace
kubectl create ns <YOUR_NAMESPACE>
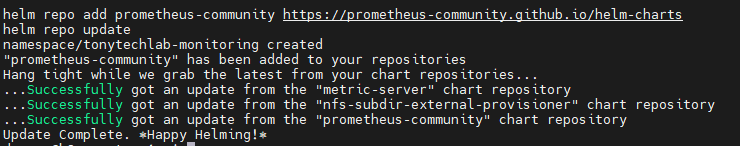
# Add repo
helm repo add prometheus-community https://prometheus-community.github.io/helm-charts
helm repo update
Create file values-prom.yaml and update with content below
prometheus:
  prometheusSpec:
    storageSpec:
      volumeClaimTemplate:
        spec:
          storageClassName: <STORAGE_CLASS_NAME>
          accessModes: ["ReadWriteOnce"]
          resources:
            requests:
              storage: 10Gi

alertmanager:
  alertmanagerSpec:
    storage:
      volumeClaimTemplate:
        spec:
          storageClassName: <STORAGE_CLASS_NAME>
          accessModes: ["ReadWriteOnce"]
          resources:
            requests:
              storage: 2Gi

grafana:
  persistence:
    enabled: true
    storageClassName: <STORAGE_CLASS_NAME>
    accessModes: ["ReadWriteOnce"]
    size: 5Gi

  service:
    type: NodePort
Installing prometheus
helm upgrade --install <YOUR_DOMAIN> prometheus-community/kube-prometheus-stack \
  -n <YOUR_NAMESPACE> \
  -f values-prom.yaml
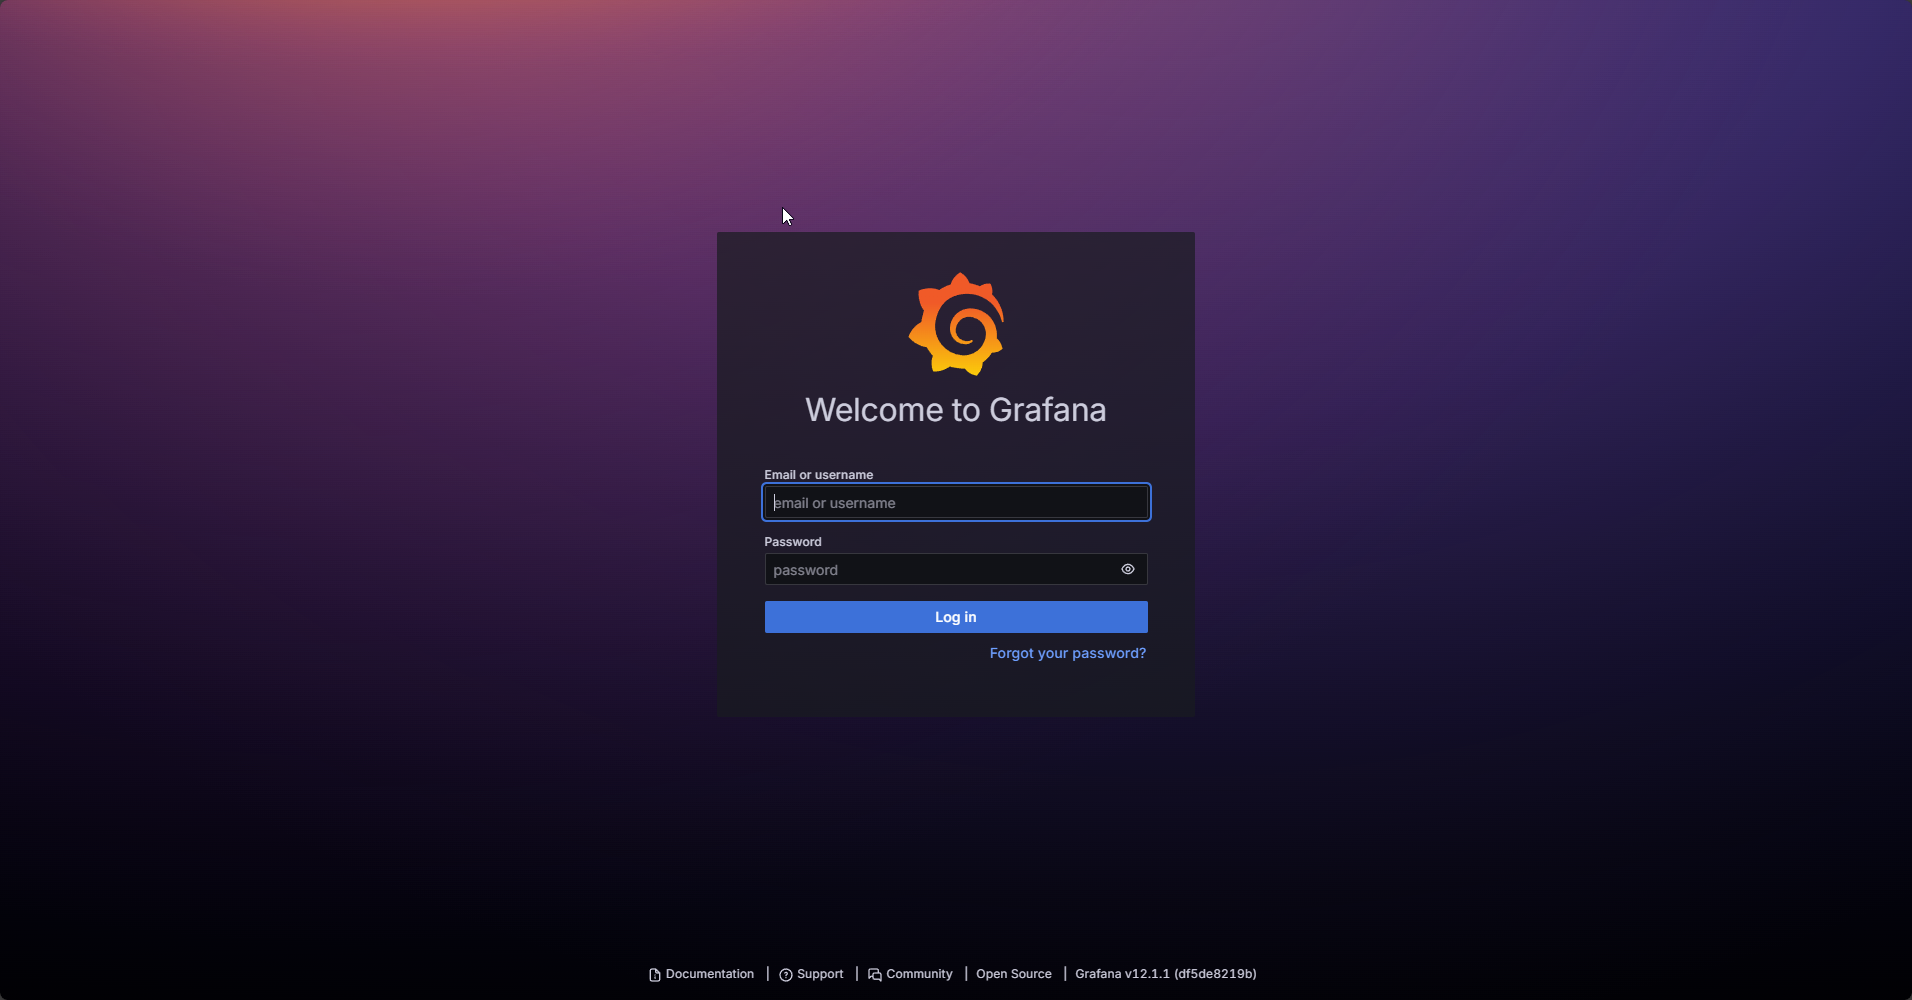
Access grafana
To get the exposed node port for grafana, run kubectl get services -n <YOUR_NAMESPACE> on the master node.

Access it by <MASTER_NODE_IP>:<NODE_PORT> with following credentials:
- Username:
admin - Password:
prom-operator
Conclusion
In reality, the others can use different platform for monitoring. But Prometheus and Grafana are widely used. In the next article, I will present another way for monitoring but it's cheaper and lighter.
Happy Coding!